Showing posts sorted by date for query gap. Sort by relevance Show all posts

Monday, September 14, 2015

The open: Trendlines, Gap and setups


Shallowest Trendlines

The price action of the prior day give rise to two trendlines -- the shallowest bull and the shallowest bear trendlines of the prior day. The shallowest bull trendline is drawn from the lowest point of the day and touches another point such that all the price action past the lowest point is on one side of the line. The trendline should not be concerned about the price action before the low of the prior day. The shallowest bear trendline is similar from the high of the prior day.

When there are multiple points that are at the same point, as in bar 24,25 lows shown above or when the lows are formed by a double bottom of two separate swing points, simply use the most recent as the low of the day, i.e. do not draw a horizontal line.

When the next point is very close as in b28 above, the trendline could be shallow and inaccurate when drawn manually.

The price action of the current day should be expected to react to the trendlines from the prior day and then make a significant move.

If the last bar of the prior day is the highest bar of the day, there is no shallowest bear trendline. On the other hand, you can draw a shallowest bull TCL. TCLs are less significant than TLs and are only used for reversals when the price opens beyond it.

Gap

When the price action of the day opens well beyond the trendlines, the trendlines may not have any significance. When the gap is small (3 to 5 bars distance), a test of the line is likely to occur before any strong trend move. If the price opens between the two lines, there is a good chance of both lines being tested before any significant move.

If b1 of the current day overlaps with the last bar of the prior day and the prior day ended mid-trend move, then for all practical purposes, the open can be treated as its a continuation of yesterdays trend and the shallowest TL from the prior day be treated as the trendline for support, setups, etc.

Chances of an early trend

When b1 of the current day overlaps with the highest and lowest bar of the prior day, or the prior day ended in a large trend leg and b1 of the current day overlaps the last bar of the prior day, chances of an early trend including trend-from-open are high. When the price opens near to the shallowest trendlines from the prior day, it also increase the chances of a significant trend during the open (first 12 bars). On such days, look for 1P setups. You should hold a swing position since this could be a large move.

1W

1W is the default open setup. If nothing else happens within the first hour, its likely that the price will give three pushes in one direction and try to reverse up. In general, opposing bars b1 and b2 represent the opening range. Three pushes beyond to b11 represents the first 3 push of the day and should result in an attempt to reverse the W, i.e. take out the other end of the opening range. If the W succeeds in reversing in one leg, then the price should be expected to at least go further to the measured move of the W.

Tuesday, September 8, 2015

Market types and setups

The price action that defines markets can be divided into several types and each type has setups that typically work for it. Trending markets for example, facilitate with trend trades and usually cause reversal setups to fail with high probability. Trading ranges on the other hand, facilitate fading breakouts with high probability.

I divide the market price action into the following categories:

Trend (or elastic trend): There is an obvious trending in the market. Bars in the direction of the trend are small, close strong and there are multiple bars in any given trend-side push. Bars against the trend are fewer, usually larger and if there is more than a single bar, closes are usually weaker.

Hard Trend: This is a kind of trend where there are very few bars in the counter-trend direction. With-trend bars can be large or small, pullbacks are usually just a bar or two. This is a very strong trend.

Soft-trend: Bars are very small both trend-side and counter-trend-side. Very shallow pullbacks and pushes.

Channels: Channels look like Soft-trends but with one big difference. Unlike the trends above, a pullback in a channel often overlaps into the previous signal bar.

Trading Range: There is no discernible trend. Erratic movements usually lasting two or three pushes in one direction followed by pushes in the opposing direction. A move in one direction may or may not reach the other side before reversing, therefore hard to gauge profit target.

Barb Wire: A special kind of Trading range where the price action is confined to a narrow range made of small bars, many of which are dojis

The Open: Markets that have "Regular Trading Hours" have opens and closes for the day and the open of a given day has often behavior that may look entirely unlike the previous day. When the market opens and the first bar begins to form, the market is not in any of the above states yet and is considered to be in the open state. This lasts for about 10 bars or so.

The Setups
Each price action type has its own list of setups. A setup that works very well for hard-trend will fail for a channel and vice-versa. These 30 setups cover every possible large move from any type of price action. If you master these, you can trade any market.

There is a small number of setups per price action type and you can focus on a much smaller set of patterns. Setups marked beta are sustained observations but I'm unsure if they can be traded profitably in all kinds of markets. I may drop them in the future.

Setup List
SetupNameTrade typePrice Action Type
GRb1Gap reversal b1X -- BetaOpen
ib2Inside bar b2X -- BetaOpen
1Fb11st failure of b1XOpen
2Fb12nd failure of b1XOpen
1P1st pullbackXOpen
1FBO1st fbo of ORXOpen
2FBO2nd fbo of ORXOpenGGap
1W1st Wedge of dayXOpenRReversal
1TL1st close at TLXChannelTtrend
1CBO1st channel BOXChannelbbar
1ib1st inside barXChannelb1bar 1
CBPchannel BPXChannelPpullback
CXTchannel XTXChannel1P1st Pullback
SDshallow+deepXChannelSsmall/shallow
fL2failed L2X -- BetaChannelOROpening Range
fL2failed L2XSoft TrendTLTrend Line
STbsmall Trend barXHard TrendBObreakout
Tb1Trend from b1XHard TrendBPbreakout+P
2_1tF2nd 1TFXHard TrendPpullback
2SP2nd shallow PXHard TrendXTexpanding TRI
1TAIL1st TailX -- BetaHard TrendTRITriangle
WPWedge pullbackX TrendBWBarb Wire
TLPP at TLXTrend1TFone tick failure
WWedge ReversalX RevTrend
Rfx2Reversal+fx2X RevTrend
W1PW + 1st pullbackX RevTrend
FBOFx2FBO + FX2X fBOTrading Range
WFBO, DPWedge FBOX fBOTrading Range
TRI BPTriangle BPX BOTrading Range
XTExpanding TriangleX BOTrading Range
BWBOBreakout from BWX BOBW


Setups not listed above such 1Rev, A2, BO, etc are obsolete due to various reasons such as being incorporated into the list above, me not using EMA anymore and inconsistent profits.

Thursday, September 27, 2012

Components of a successful trade


A trader needs to determine 4 important attributes for a successful trade:

  • Direction
  • Probability
  • Room for profit
  • Stop

Direction is obvious. If you are on the wrong side of the market, your chances of a scalp trade are smaller and chances of a swing trade are nil. A simple way to determine direction is to draw a trendline and trade only when the price tests the trendline. Trendlines should be drawn from the start of the move. Most days, this would be from the LOD or HOD but some days such as today, the beginning of the move could be a different bar such as b24. Experienced traders can also detect a reversal such as the three push reversal at b9 and trade the reversal of a trend. New traders should skip reversals and take the first reasonable pullback after the successful reversal (b24).

Probability of success takes slightly more experience to judge. On most days, after determining the market is in a trend, you can take every two legged pullback such as b44 until the trend breaks (a sustained move beyond the trendline). On hard trend days, you can take any pullback and any small signal bar in the direction of the trend as long as the entry side of the signal bar does not have a large tail.

Room for profit takes quite a bit of experience to judge. In a normal trend, a pullback can be expected to at least take out the prior extreme by one tick and therefore a deep pullback is likely to give sufficient profit. However in hard trends and large gap opens, even a couple of ticks may give a decent profit. High volatility and clean patterns are friends when it comes to profit targets. Barbwire and tiny bars are terrible enemies and greatly interfere with profit target estimation.

Stop size is possibly the hardest to correctly determine. Signal bar stops often work but could be too large from a risk:reward perspective. A fixed stop is easy to use for clear patterns and strong bars but very hard for channels and overlapped bars. For example, despite correctly reading the low of the day today, my stop was short by 1t resulting in a losing trade and missing out on a great swing setup.

Taking a fixed stop and continuously keeping track of market direction using the nine transitions means you only look for probability and profit target when entering a trade. Passing up shallow pullbacks means you only need to focus on probability, which boils down to looking for a clear set of patterns and strong signal bars.

The fewer parameters involved in your decision making, the more confident you will be in your decisions and help you become a successful trader.

Monday, September 3, 2012

The hard road to consistency IX -- The need to re-learn lessons over and over


A trader should be expected to constantly having to learn and re-learn lessons and this is just part of learning to trade. Some of this is due to being emotionally reactive. A trader who sees a huge bar like b8 may be tempted to sell below it and is likely to be stopped out. Similarly, a trader may short a bull trend all the way to the top and blow up an account.

The first step is to understand what made you fail. Did you enter on fear of being left out instead of waiting for a setup? Are you deficient in some price action principles? (shorting all the way to the top = does not understand trends can go on indefinitely). Are your stops too tight? Are your targets too lofty? Do you enter too early? Do you love to pick tops and bottoms? Do you enter before a signal bar closes only to find that the good looking bull bar 30 seconds before bar close is now a bear bar? Do you enter on limit banking on your ability to predict reversals to the tick? Do you misread overlaps and chop as patterns?

Whatever your errors may be, you need to first identify them. The next step is to figure out the right way to trade those situations. Ignoring actual reversals and taking the 1st pullback after the successful reversal alone eliminates over half the errors above. Using proper trade management eliminates most of the others. If you can get here, you should be breakeven to slightly profitable on most days. But to get here, you need to practice over and over and only sustained effort can break your bad habits.

Days where price action exposes a large gap in your experience (counter-trend trading on trend days) are likely to still create large losing days and therefore, you should switch to SIM to collect data on these days. Identifying market structure responsible for huge losses and acting on them is a much harder task, but the fact that you switched to SIM after two losing trades enables you to stay in the game and figure out ways to identify and trade such exceptional days.

Even so, there would be rare days such as the flash-crash that could still give you some trouble. But you would be far more confident in your trading and welcome the opportunity to learn from exceptional events.

Monday, June 25, 2012

Channel risks


A large gap up or down often does not result in a steep trend but rather in a shallow sloping channel. Of course, all moves can be contained in a generic parallel trend and trend channel lines and be called a channel but for the purposes of this post, a channel is a specific type of price action that represents a very hard to trade move.

A channel can be easily distinguished from a trend by the following characteristics:


In a channel, most with-trend bars overlap each other. In a trend most bars don't.
Compare the leg from b7 down to b12 vs the leg up from b47 to b50. Notice the almost complete overlap of bars in the former.

Most bars in a channel have tails on one of both ends.
A strong trend should be made of trend bars, at least in the trend direction. Notice the strong closes on the up legs b47050 and b68-72.


Channels are highly likely to take out fixed stops and breakeven stops.
Shorts below b7 were triggered and unless they had a large stop of at least two points or more, were probably stopped out. Strong signal bars at b14 and b18 had their breakeven stops taken out. Such price action can make it hard to catch a swing using the normal trade management style.


Channels can reverse on the most unlikely bars.
This makes channels very dangerous to trade. For example, today the channel reversed on b31, which was a bull doji not unlike b9,16,27 before it.

The only way to trade channels is to get in early trail behind every new swing point (b14,18,23,28 for b7 shorts). Channels can reverse at anytime and channel in the opposite direction and that makes taking a potential early reversal (say within the first hour or two) potentially a day long swing.

Monday, June 4, 2012

Small or no gap


When the gap between the last bar of the prior day and the first bar of the current day is very small (overlapped or less than recent bar), You can treat current day's price action as an extension of the prior day's price action, at least for the first hour or so.

Therefore, when a small reversal bar forms at the trendline from yesterday's down channel, its usually an acceptable trade, even on the first attempt as long as the signal bar is not weak (doji or overlapped). If you take it as a setup, you should expect it to take out the last swing from the prior day.

As the day progresses, a newer clearer trendline will form (b2,18) and will take precedence over prior day's action. Future trades should be evaluated using the recent price action of current day.

Wednesday, April 25, 2012

Failed trades reveal market information


When a trade fails, it should give you some information that you can use in subsequent trades. If a failure does not give you any information, you should avoid trading it. Most of my setups give certain definite information about market structure when they fail.

For example, b9 today was a possible 1PB setup. Its a poor bar, being essentially a red bar, the pattern is a 1 legged deep pullback and the location is a double bottom with a strong trend bar. Even though I never usually buy 4 red bars, during 1PB I relax my rules a bit not because the trade is higher probability but if it works, the risk to reward ratio is usually worth it.

When b9 triggered and took me into a trade, if it works I expect a large bull day and given the recent deep pullback on the daily chart, it could be a 10 point or larger move. However when the gap open is large, there is always the risk of it being too expensive for fresh buyers and the trade could fail. The trade did fail when b13 stopped me out.

The failure gave me new information: Today would not be a trend day but rather a trading range day bounded by the AM spike (b1-b5). The only acceptable trades now are buys in the lower third of this range (b22, b41) and sells in the upper third until a breakout and BP sets up (b73). A marginal setup such as b50 can be passed up since its not high enough in the range and in barb wire.


Monday, April 9, 2012

First bar: Reversal bar


When the first bar is a reversal bar in a place where it does not make sense such as a bull bodied reversal bar above a gap or overlapping the prior day's range, there is a good chance it is a setup for failure. On the other hand, a bull reversal bar below a large gap will often begin a trend from the first bar.

When it fails to produce a trend from the first bar, chances are high that the day will turn into a trading range day. This means whenever there is a new breakout, you can look for a fBO trade is the range is large enough (4+points).

Occasionally, such a breakout gives a BP trade such as b26, which can be held often to the measured move of the opening range.

Wednesday, April 4, 2012

Fading a strong trend instead of trading with trend


One of the classic trader's error is to fall in love with their first position. If a trader bought b2 since he may be expecting gap closure or b5 as a possible second attempt to close the gap or 1PB, he may be surprised when the market stops him out and takes out the low of the day.

When he later sees b9, he may see a reversal bar. b12 may appear as a reversal bar after a possible 1 bar FF at b11.  b12,13 may appear to be a rather strong 2 bar reversal. The trader may end up buying every one of these and getting stopped out every time. (The alternative, adding on at every new signal is far more dangerous).

One of the reasons I prefer to trade on breakouts of signal bars rather than simply buy on close is that it prevents me from entering into many incorrect trades such as these.

The complementary situation  is the trader who was right about the initial direction but fails to see the trend break (b19-b27) and test (b49) and insists on shorting every move up. After a major reversal at b49, there are no more short trades and b58 therefore is not an A2 short. (A common reason for failed A2s is being in denial about trend termination or trend reversal).

A common reason for such behavior is the trader's bias about market direction. This bias may be a fundamental bias caused by reading too many economic blogs or watching TV or other inherent biases about the strength or weakness about the world economy that the trader wants to see reflected in the market today.

Traders who don't watch news are possibly subject to technical bias. They may have an inherent belief in some pattern or indicator and are expecting a strong reaction. It is correct to trade those and natural for some of them to fail. The trader however, should not repeatedly enter a trade in the same direction assuming he would eventually be proven right. This is the need for acceptance and is a strong human trait. You should not let it meddle with your trading since the market is too impersonal to either accept or reject you.

The trader needs to realize that all biases and opinions are always wrong regardless of their direction. Only the market is right and for a day trader, the strength and underpinnings of the economy are meaningless. Patterns and indicators are tools and they fail occasionally no matter how reliable they may have been.

The right way to trade is to accept only what the market presents and be aware that trends can break, trading ranges can breakout and nothing is guaranteed to run forever or reverse eventually.

Monday, March 26, 2012

Signs of an extremely strong trend


When the prior day has formed a strong signal bar on the daily chart, the next day can often be a large trend day. A large trend day can often be held for a swing till the end of the day.

Signs of a strong trend:

  • Strong close prior day (b81)
  • Large gap, no selling (b1, b3,5)
  • Strong breakout from opening range (b8-10)
  • 20 bars or more before reaching ema (b33)
  • Multiple A2 and fL2 (b47,54,62,75)
  • Small moves off counter-trend signals (b22,28,33,64)
  • Sideways pullbacks (b43-47, b51-54,b61-65)
  • failed W (possibly W42,50,59)

On a very strong day, its acceptable to trade overlapped signal bars and doji signal bars as long as they are with-trend.

Tuesday, January 24, 2012

Signs of counter-trend strength in a gap open


Large gaps tend to widen rather than close, since something fundamental would have changed to cause the large gap. However sometimes a large gap will attempt to close and will trend for the rest of the day, often closing at its high.

The first bar after open (b1) closing opposite to the large gap is usually the first sign of strength. If its an average size trend bar or a reversal bar, its a very strong sign. (If the gap is small, the bar could simply act like a pullback and should not be considered).

A b2 triggers such a b1 and closes strong is a second good sign. If b2 attempts to widen the gap and fails giving an fBO (b3) its also a good sign.

1tfs (b7,9) and 5tfs on attempts to widen the gap are the next signs to look for.

Strong trends will usually have shallow pullbacks and average sized bars instead of deep pullbacks and large bars.

Wednesday, January 4, 2012

The opening fBO


When the first bar is clearly a trading range bar, such as a doji, a large bar with tails on both ends or even a trend bar followed by a trend bar in the opposing direction, there is a very good chance that the first or second fBO of the opening bar can lead to an opening trend move, even if its a small one.

This is because a trading range has buyers below it and sellers above it. Today the buyers below b1 were weak and were overwhelmed by sellers above. This is to be expected and led to a large move that ended in a W reversal.

Many days, when the opening range is small, the market can create multiple fBOs generating an expanding triangle until one of the fBOs fails, resulting in a BP that in turn leads to a trend.

When the opening range (b1-6) constitutes a weak attempt to close the gap, there is a decent chance that its failure will lead to an attempt to widen the gap. This attempt (b6-14) is usually a tradable trend move.

Tuesday, January 3, 2012

The January effect


A large gap and a move up on the first trading day of the year is generally considered a good omen and a predictor of a bull move for the next few months. When the market closes near its low, the strength of this assumption is weakened.

On many years, this is an expected gap open and some traders will take a long position on the last trading day of the prior year and exit on the open for a very good profit. This is still gambling however, since a gap down can wipe you out.

Trading based on a large overnight move is speculation and should be done with caution. A small position may be taken using call options, but a larger position required a spread, butterfly or other limited risk option strategy.

Earnings, interest rate changes, government announcements, etc can also be traded this way.

Correction: The original chart showed a buy above b6 on the fL2. The actual buy was at around the same price but above the first bar of the 3m chart as shown below.

Monday, November 14, 2011

The first two legged pullback


On many days, the open may constitute an opening range made up of erratic moves (b1-25) that finally break into a trend (b26-b38). Some traders may get repeatedly stopped out on the initial range and their later trades will barely make up for their initial loss.

The trick to avoiding being chopped up on the opening TR is to wait for a trend attempt and take a clear pullback on a strong signal bar. This is essentially the philosophy of the 1PB trade.

Determining if a leg is a trend attempt is a bit tricky. Any two or three trend bars are a possible trend attempt. One bar does not usually make a trend (unless its very large). Once a trend is attempted, it will either reverse and a new trend is attempted in the opposite direction or a pullback gives a possible continuation of the orignal leg. A strong reversal attempt is 1Rev. A pullback is 1PB.

Today, there was a trend attempt from b3 to b5 and a weak reversal attempt on b5. Then possibly a second trend attempt from b6 to b9. Note that this bar is made up of weaker bars and is unlikely to succeed, especially in the absence of prior bull strength.

b16 represents the first two legged pullback of the day and is a possible 1PB long entry of the long trend attempt. However, the signal bar was a doji and the reversal was fairly weak. However, this is still a viable long entry. When the long entry failed to take out the old high, it turned into a first 2 legged LH, turning into a 1PB short at b20 of the original short trend attempt.

Another way to read this is that b2 and b9 represent two failed attempts to close the gap leading to a bear trend. Even though many traders may have correctly read b9 as a possible 1PB short, waiting for a strong signal bar (b26) is usually the right thing to do for a profitable entry. This is because shorting below a bull bar is always subject to failure, regardless of the correct read of the market direction, especially on a choppy open.

Friday, November 11, 2011

Trend termination (TT)


Recognizing a potential trend is generally easy on a day like this: A large gap followed by two or three bars that close in the direction of the gap is a very strong trend attempt and taking the 1PB (b5) and holding it to swing termination or reversal is an easy decision.

Not all trends reverse and many of them simply terminate into a trading range. Determining the end of a trend requires some experience. There are primarily three ways a trend can terminate and today, we were lucky to have all three.

The first is a TTR made up of small overlapping bars made of mostly dojis. Given this criteria, we should already know around b22 that the trend has terminated.

The second is an extended trendline break. A move beyond the trendline for many bars and many points is a trendline break. The more number of bars it stays beyond the trendline, the fewer the points that need to be beyond the trendline to constitute a break. This means that a single bar thats sufficiently large can break the trend or a large horizontal or slightly sloping movement for about 20 bars (b21-39) can break the trendline without dipping too far below it.

The last is a failed reversal followed by a failed continuation. b22 was a poorly formed W and FF that was followed by a WP at b39 which was unable to take out the reversal bar.


Once you realize the trend has terminated, you should no longer be looking for with trend trades. Your best option is to wait for a new trend to break and enter on its first pullback. If the trading range following the TT is small, its best not to enter into anymore trades at all.  If the trading range is wide (8+ points), you can consider fading the extremes of the new trading range. Note that in general, you should cannot expect any entry in a trading range to make a large move. In general, you should expect a move that's roughly half the size of the trading range.

Friday, November 4, 2011

2 Failures to close gap


On many days when the market opens with a reasonable sized gap (4+ points), the market will try to close the gap twice. If it fails on both attempts, there is a high probability of a strong trend in the direction of the gap before the market tries to move against the gap.

The larger the gap, the larger the trend move before any attempted reversal.

Today opened with a reasonable gap and a doji bar b1 with a close near the low of the bar, which is a poor signal for a long and was likely to fail. The second signal was another doji but with a higher close and was also a failure. The presentation of poor counter-trend signal bars is a strong indication of continuation of the trend.

Two failures led to the market breaking into a trend and extending the gap all the way to bar 14. On the way, a fH1 at b9 marked a precise exit near the low of b14.

Video of trade available on youtube

Monday, October 31, 2011

Anticipating late trend breaks.


On a large gap day where the open is beyond the range of the prior day, the likelihood of trending is high. If the first bar does not lead to a hard trend, there is a very good chance it will at least attempt to pullback to the ema and then break into a trend in either direction.

Once the day has stalled into a trading range, any trend break is likely to happen from the other end of the range, i.e, bull trend breakout from the bottom of the range and bear trend from the top of the range. This is why you should only buy low and sell high in a trading range.

A 1tf such as the one on b24 could lead to a trend but when the range is small, the likelihood is lower. A trading range typically tries to widen before it breaks into a trend. A common way to expand the range is to take out repeatedly both ends of the range until the range is wide enough. This is an expanding triangle breakout and any sharp breakouts can be faded until an upside break and 2L HL or a downside break and 2L LH.

The second option is to give a breakout pullback. b36 was a strong breakout of the trading range and gave a LH 3 push pullback to b53, which was also a DP. These are usually trend generators and should be taken.

Entering mid-range such as the entry at b28 should be avoided unless you have reason to believe you are in a trend (LL and LH) or you are entering on a BP. In general your best swing entries are near the ends of the trading range after the trading range has been made sufficiently wide by prior failed breakouts.

Thursday, October 27, 2011

Very large gap up


A large gap acts as a spike and if the price is very far from the ema, its very likely to pullback close to the ema. A 2 legged pullback to the ema is a very strong signal on a large gap day. The larger the gap, the deeper the initial pullback (b1-b14) and may look like a mini trend.

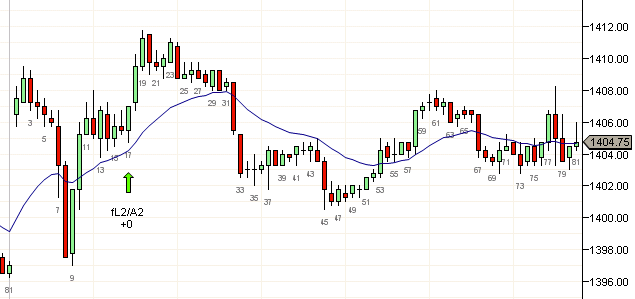
Just like a day that opens with a large spike bar, a very large gap day is likely to act like a soft-trend day with very shallow pullbacks. When the first higher low is a fL2 (b19,b22), its a very strong sign of an impending soft-trend day and you should never trade counter-trend.

On a soft-trend day, you can trade above doji bars (b42,58) as if they were bull bars provided they are close to either the trendline or the ema. When in doubt, you can always trade above a strong bull bar following the doji signal bar (b43,b59)

Wednesday, October 26, 2011

Anticipating AM trend reversals.


I have often stated that consistent success lies in the ability to get in on a trend early, especially the AM trend. Often an absence of an AM trend may mean a potential PM trend if the day opened on a large gap but on many days its just a TR day (regardless of gap).

Occasionally, however, we get an excellent AM trend which breaks and instead of turning into a trading range, reverses into another excellent PM trend.

To anticipate such moves, watch for a large gap and an open within the range of the prior day (b1). If the trend move breaks an extreme of the prior day in three pushes (b5,10,18) and gives a reversal signal (b18), there is a very good chance the next two legged pullback (b45) will break into a trend. This trend should be expected to at least take out b1 and therefore is an excellent swing candidate.

Tuesday, October 25, 2011

Huge open bars


Large bars on open are rare, but when they happen, your best bet is to enter early. One method to enter is on a 5t move from the open and only in the direction of the gap. So for today, you would short when the price hits the purple line shown above. On most days with large gaps, the price will not take out a breakeven stop at this point for the rest of the day or until there is a W or other reversal.

Large bars represent trading ranges and large bars on open are no different. A sequence of large bars is invariably followed by a pullback and a test of the extreme regardless of how deep the pullback is.

This is because the large bars represent a spike and with trend spikes are usually tested. A large range in one or two bars (b1,2) often sets up a narrowing triangle (LH,HL,LH,HL...) as the market tries to find a balance between the two ends of the range.

The safest way to trade a triangle is a triangle BP.  Basically, wait for 2 HL or 2 LH to be taken out (b41,23 taken out at b62) and then take the next pullback. If the pullback is 2 legged as in b68, its usually an excellent setup.

Until the triangle breaks out however, you can take with-prior-trend entries only and best if they violate a trendline. Trading a triangle against the prior trend is dangerous and should be avoided. Watch the poor entry bars and pullbacks for buyers above b8, b23 and b58.