Friday, September 30, 2011

Price Action Basics VIII - The opening range and its measured move.


On some days, there is no clear initial trend and the first few bars of the day are simply a trading range. Two up and two down moves that don't go too far from the open make an opening range. On many days there will be no successful breakout of the range and the market will oscillate between the bounds of the range and every breakout attempt will fail.

When the market fails to break out twice (b11 and b27), it normally tests the other end (b61).
However, when the market does breakout successfully, it will often reach the measured move of the opening range.

A three push failure (b3,11,27) on one end of the TR often results in the successful break on the other side. A simple but fairly successful way to trade these moves is to take the first HL long and the first LH short of the day as long as they are close to the prior swing and hold till the other end is taken out. For example, you would buy above b19 and sell below b37 or b53.

A 2 legged pullback after a breakout(b69) is possibly the first A2 in a new trend and is a high probability trade.

Thursday, September 29, 2011

Price Action Basics VII - The Initial trend, 1Rev and 1PB


After zero or many fBOs off the first bar of the day, the market may attempt to trend. This is called the initial trend and if its strong, it may eventually persist till the end of the day. However, on most days, there will be an attempt to reverse the trend.

If b4 was the initial trend attempt, then b5 is its reversal. On the other hand b4,5 could simply be another fBO and b5 to b8 could be the initial trend. b9 would then be the first attempt to reverse the trend. If this attempt is feeble, then it will fail and turn into the first pullback of the trend or 1PB. Often the protective stop above 1PB is not violated for the rest of the day (including today). This makes 1PB often the best swing entry of the day.

For practical reasons, the first deep pullback is usually a better swing candidate. The W at b29 or the W1P at b36 make excellent 1PB entries and are often the best practical swing entries of the day. This is because a protective stop of a deep pullback is less likely to be taken out before yielding a swing profit and a deep pullback is easier to enter than a one bar pullback such as b9.

Today, there was an excellent PM move, but on many days, the AM trend is the only large move and the lunch and post-lunch hours do not yield any large moves unencumbered by choppy movement and stop runs. This is why mastering the 1PB entry is crucial to profitability.

Wednesday, September 28, 2011

Price Action Basics VI - The first bar


According to Al Brooks, the first bar represents the day in a nutshell on most days. As you can see, today that was not true. My modification is that the first one or two bars represents the AM movement. If the first couple of bars are strong trend bars in the same direction, there is a good chance of a trend move (either with or against the first two bars). If the first bar is a trading range type of bar or the first two bars are opposite colored and overlap (even though they are trend bars), then the market is forming an opening range rather than an opening trend.

The first bar is special, because it is the only bar thats guaranteed to give both a new HOD and LOD. From this point on, you can trade fBOs and BP of b1 and continue with every new HOD and LOD. A bar with tails such as b1 today should be considered a small trading range. Such an opening often leads to an expanding triangle open, which essentially is a series of fBO of every new high and low until one of them gives a two or three legged LH (such as b30) or HL and begins a trend move.

Trend bars on open show energy and will often lead to an AM trend. Those trends will often reverse and lead to a prolonged trend that could last all day.

A reversal bar on open will often give a sharp move that will turn around and take out the other end of b1. This is especially true if the reversal bar is in the wrong place, i.e., mid-range or a bull reversal bar above a small gap, etc.

Doji b1 can give a small fBO on one end of the bar followed by a prolonged move when the other side of the bar breaks out. But it can also lead to BW open.

Regardless, the size and form of b1 is only a guide and should not be relied upon religiously. There are various edge cases that are too numerous to list and can only be mastered with experience. The right way to approach b1 is as if its a trading range and trade it as if its a small trading range. That is to say, if there is a strong breakout, enter on a pullback and if there is a weak breakout, fade the breakout. Remember that fBO of small ranges is usually not worth the trouble and that applies to b1 as well.

Tuesday, September 27, 2011

Price Action Basics V: The Open Gaps


The open is a very complex set of topics and gap opens are an important source of information about the day's price action. Occasionally, the market opens very near to the close of the prior day (less than one average bar). This usually can be traded as if there was no gap and the open is simply continuation of the prior day's price action. Usually, the open almost always is a few bar lengths away from the close of the prior day. This is a small gap and usually this acts like a breakout or a trendline break. Usually, the market attempts to close small gaps giving either a pullback from the gap breakout or re-test after the gap trendline break. Sometimes small gaps will extend before closing and this will lead to a protracted trend after reversal. When a small gap extends, you usually have no idea how far it will go but you always know that the reversal will test the close of the prior day.

Gaps that give an open within the body of the prior day, especially mid-body are suspect. No matter which way they trend, they are likely to reverse sometime within the day.

In other words, most days are likely to trend trying to close the gap. Naturally, if it tries to close the gap in two or three attempts and fails, the market will usually give a large trend in the opposite direction. Keeping the above in mind is very important to determine 1Rev correctly.

The last case is the large gap (about a day's range). A large gap can lead to a large trend if it tries to close the gap. If it tries to extend the gap, it often behaves like a spike and channel with the gap as a spike. This often means its a soft-trend day. A large gap down can give a hard trend if it tries to widen the gap.

However, a large gap simply gives a trading range, which can lead to a gap closure late in the day (as in today's chart). A good metric for the trendiness of a large gap is the first bar, which if its a average sized trend bar is likely to lead to a large trend day. A doji or other poor bar such as today's b1 usually indicates a poor AM trend.

Determining the likely primary direction of the day improves your chances of a successful 1Rev and 1PB entry, which in turn allows you to swing for larger number of points and increases your profitability.

Monday, September 26, 2011

Price Action Basics IV: Trading ranges, Trends, fBOs and BPs


A breakout from a trading range is an attempt to create a trend and its failure is a move back into the trading range. A successful breakout leads to a trend. Similarly, a successful failure to resume the trend leads to a trading range. Today, b15 and b28 were failures to resume the trend and b67 was a successful resumption of the trend.

After every breakout, the trader needs to decide if he will fade the breakout or enter with the breakout on a pullback. In general, when in a trading range, a trade on the failure of the breakout is more likely to succeed and certain important signs are needed to trade with the breakout.

The signs are:

  1. Breakout is strong (i.e., half or more of the breakout bar is beyond the break point)
  2. Strong close
  3. Second attempt to breakout
  4. Poor attempt to fail the breakout


Lets look at these one by one:


  1. Strong breakout: b27 and b67 were both very strong breakout bars, but b67 was more than halfway above the break point. Even though b27 was less than halfway out, there was a good chance that a 2 or 3 legged pullback could give a second attempt up. On the other hand b10 was a weak breakout with weak close.
  2. Strong close: A strong close beyond the breakout point indicates that there were insufficient fade orders at the break point. A weak close followed by a deep pullback (such as b29-46) indicates possible failure of the breakout. A weak close such as b10 indicates fade orders were waiting and a failed second attempt (b15) is likely to seek the other end of the range.
  3. Second attempt: Second attempts are stronger than first attempts and second attempts of strong closes usually are very successful. An fBO (b28) that fails to take out the other end of the range (b15 low) should be treated like a deep pullback and is a possible trend break (HL after HH). This is especially true after a fL2 such as the one at b50.
  4. Poor attempt to fail the breakout: b11 and b15 are strong attempts to fail the breakout. Usually, when the first failure is pronounced (b11,12), the second will usually go much further (b15-b27). If the bar after the breakout bar is a reversal or inside bar with a strong close such as b28, there is a high probability of at least 2 legs down, possibly deep. If the attempt to fail the breakout is poor such as b67, and it does not trigger, the chances are very high that the price will seek a measured move of the prior range (b28-45 met at b79).

Friday, September 23, 2011

Good and Bad fBO


I've often mentioned that trading with-trend in a trend is the easiest way to trade and fBO are some of the hardest trades to take. The reason is very simple. Market inertia dictates that when in a trend, the market is likely to continue in the trend and the with-trend entry is a high probability setup. A fBO on the other hand could turn into a BP or fail on the first or second attempts and work only on the third attempt (as a mini-W).

This is why unless the range is large, you shouldn't even bother taking fBO trades. With that caveat, we can still attempt to deduce the best and worst fBO setups.

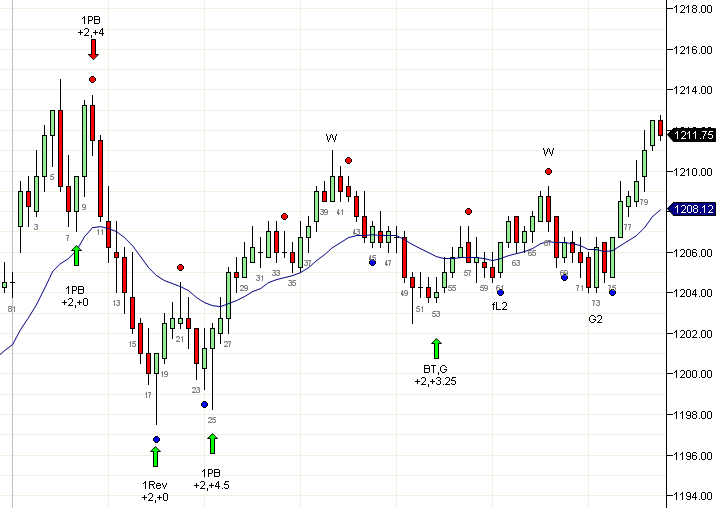
The first fBO setup is b2, the failure of the breakout of the large bar b1, which acts as a small TR. Since the entry would be in the lower half of the range, it is likely to fail, esp. since its a first entry. If the entry was very close to the high of b1, this would be worth the risk reward only because the bar is large. If the bar were 4 points or smaller, its best to ignore the fBO of b1.

The second fBO is b6, an attempt to reverse the close of prior day and three pushes up (b2,4,6). This is a higher probability trade and can be labeled OR.

The next possible fBO/BP was b16, which was a strong BO and did not give a decent BP signal bar. At this point, we have a higher high and a higher low and we are in a possible bull trend and should not look to trade fBOs. Rather we should look for 2L PB to ema or TL and take with-trend trades or watch for a trend break. This means we would ignore b21 and even b24 if it was well-formed.

The one-legged move to and close below ema at b29 possibly broke the trend, so we should again switch to looking for fBO and BP. The three push to b45 is an OK setup, but normally, I avoid taking mid-range entries when the market is not in a trend. If we had been in a trend or the move to b23 was a strong trend, I would consider buying b47 as a possible G2.

The fBO at b55 is the most desirable kind of fBO. The bar that broke above the HOD turned into a reversal bar with out overlaps of any other bar. (A doji is an acceptable fBO signal at extremes of the day). A reversal bar or inside bar after the BO bar would also be excellent signals.

To summarize, good fBOs are three pushes beyond the trading range or failures immediately after the breakout when you are certain you are not in a trend.

Thursday, September 22, 2011

Risk of pullbacks and failures


Traders are often surprised at how violently their stops are sometimes taken out such as the short below b14 or the long above b15. Signal bar selection is very important if you wish to use stop entries to enter on the breakout of signal bars. Almost all failures for stop entries have a few common characteristics and mastering them will reduce your error rate.

1. Overlaps: Overlaps, especially large bar overlaps are the easiest risk to recognize and evaluate. In general large bars are poor signal bars regardless of overlap. Any overlap practically guarantees the trading range attribute of the signal bars and you should wait for a small bar at one end of the overlap (b16, b26) and take the fBO of the overlap. Overlaps of small bars such as b47-51 are usually ok to take a second attempt with-trend. These should never be taken in a trading range (expecting a breakout for example) and never the first attempt.

2. Dojis before reversal bars: Dojis represent a trading range and a reversal bar after the doji does not invalidate this fact (b21-22). A second attempt, especially after trapping traders in both directions (b35) may be an OK entry to take even with dojis.

3. First attempts: Its clear from the charts that first attempts (b22, b33, b60) are highly likely to fail compared to second attempts. First attempts should be reserved for very clear and very specific cases such as 1Rev (b3), W reversals (b72) and 1PB or at the very least only for excellent signal bars.

4. Poor signal bars: Poor signal bars (b11, b60) almost certainly will give a pullback simply because some traders will fade its breakout. This is why a second attempt is recommended if the signal bar is the wrong color, has a long entry-side tail or is a doji. Even if the first attempt succeeds, there is usually a pullback before the market moves too far from the entry off a poor bar.

If you consider bars that had minimal pullback, i.e., went a large distance before a pullback and hence are swing candidates(b7,64,72), they usually are well-formed bars with a strong close or are second attempts (b16, 35). Restricting your entries only to such bars should greatly reduce your error rate, which is a precondition to increasing your trade size.

Tuesday, September 20, 2011

Early and late trend breaks


Early trend breaks are easier to spot correctly and the probability of them giving a sizeable trend move is high. Late trends are rather hard to predict and they will often go only a small distance or fail. This is why 1PB (b9) is a very vital setup to master. Catching the major portion of the early trend move allows you to relax and ignore the low probability setups during mid-day and optionally jump into any late trend break.

Late trend breaks are often very hard to spot and you will encounter may false starts such as the possible W at b40 or the second W at b55. The DP b22,46,49 was probably a decent signal, but the spike on b56 took out any swing stops.

The clearest and simplest entry for any trend break is a BP (b66). Even though it looks like the bottom of the range, a BP often is worth the risk given prior signals such as the failed W and the DP.

However, reading 1PB and OR are vastly easier than reading a breakout from an extended consolidation. If you cannot trade 1PB consistently, its unlikely you will be able to predict the BO from an extended TR consistently.

Monday, September 19, 2011

Overlapping bars produce poor signals


Somewhere bear b11 was a fBO or 1Rev. Unfortunately, the bars were overlapping and full of tails, so my indicator could not catch them. On such days, I look to see if the 3m chart has clearer bars. Today it did:


The risk of trading 3m chart is that they are unreliable after the first hour. For example, 3m b68, b72 and b105 entries failed even though there were reasonable bars. However, in the first hour and only if the 5m chart has overlap overflow, the 3m can be used.

Often setups that are unclear on the 5m are clarified on the 3m. For example the LOD reversal was a inside doji bar inside a bear bar on the 5m, but an ii FF on the 3rd push on the 3m. This may enable a great entry on an otherwise poor day.

The psychological risk of trading time-frames smaller than 5m is that you get addicted to the small risk and good prices and trade them beyond the first hour. This is usually dangerous, esp. during lunch hour where even the 5m chart is dangerous.

Friday, September 16, 2011

Price Action Indicator


As many of you have guessed from the dots on the chart, I've been working on a Price Action Indicator for NinjaTrader. Currently, it only highlights reasonable signal bars as described in Al Brooks book and nothing else.

To mechanically trade the indicator, a scalp and a swing portion can be entered with a 6t stop. At +2 points the scalp portion exits with a profit and the stop moves to breakeven. Ideally, the scalp portion is twice the swing portion to get the best results. The swing portion should be exited at a fixed profit such as +4 or on a second attempt to reverse a trend if the entry is with trend, i.e, long at HL (b25) or short from LH (b10). If its a counter-trend entry, the first sell signal should cause any swing portion to be exited (entry above b18 or below b41)

On a day with reasonable range such as today this should profit from most trades. For example, today the only losing trade was the short below b57. The short below b34 and the longs above b45 and b69 were first attempts (L1/H1) and would not be traded. One option is to mark the L1/H1 in a different color since eliminating them is not an option since that would eliminate any signals in a hard trend.

A 2 contract scalp + 1 contract swing would have made +40 on the wins and -3 on the losses. But today was possibly an excellent day for the indicator and not all days are so generous. To collect more data, I would need to automatically trade it and run it over a couple of years worth of data. I expect poor performance on tight trading range days since two point scalps are probably hard on a 5 point day. Large range days would probably be indeterminate, causing stop outs before the profit target is reached but a single swing may compensate for many losses.

Thursday, September 15, 2011

Price action Basics III - 1st Reversal or Opening Reversal


When the day opens, one option is to treat the first bar as a trading range and watch for fBO and BP of b1. If the BO or  fBO looks compelling, it may lead to a trend and you should take a strong signal bar such as b8 or b19. The larger the distance to the other extreme of the day, the higher the chances of a trend developing. Therefore, its perfectly fine to ignore something like b3 and wait for a break above the HOD (b1 at this point) and wait for a failure or BP.

When the move is possibly a trend move (b8-b19), no matter how small, its reversal is a 1Rev and is likely to lead to the primary move of the day.

Since 1Revs can fail, conservative traders can take a 1PB if the fBO or BO succeeds. In other words buy only the HL after a bullish reversal and a LH after a bearish reversal. Today's 1PB would be b24, which is not well formed, so its acceptable to skip it and wait for the next setup. You should only take with-primary trend setups until the other extreme of the day is taken out.

This strategy works for almost any day except tight trading ranges with tiny bars. On those days, very few things work and price action entries have a high failure rate, so its best to skip trading if the range of the first hour or two is very small, especially if there was no gap on open.

Wednesday, September 14, 2011

Price Action Basics II - Reversals and pullbacks in trends


When the market is in a trend move, it will continue to be in the trend until there is a very strong overshoot or a very clear trendline break. When in a trend, every counter-trend signal is probably a trap and you should ignore it and wait for its failure. Even with the very clear and obvious W at b53 after an obvious buy climax, the risk of failure is high.

An obnoxious overshoot such as b11 or an obvious trendline break such as b74-79 and a successful test of the extreme is necessary before any counter-trend trades are attempted. A failed L2 (b13,15) after a bullish reversal (b11) is a strong confirmation of the reversal and the next buy signal is usually good for a swing.

The W entry is the only counter-trend trade you ever need to take since it usually gives a confirmation and a with trend W1P right after. Every reversal signal in a trend is probably a pullback and nothing more until counter strength is demonstrated. You should look for with-trend signals near the ema or trend line. Ignore signals far away from them (b30,46,52) since they imply possibly another leg in the pullback.

Tuesday, September 13, 2011

Price Action Basics I - Bar selection


The very first thing to learn about price action trading is signal bar selection. If you do nothing else but trade every well formed bar, you will make money on most days. If you trade well-formed bars only with-trend, you will make money consistently. Enter above a bull signal bar with a stop below it and vice-versa for bear bar. If the bar is too large or too small or has lots of overlap, use a money stop of 8 ticks.

The indicator above plots a red dot above any reasonable bear bar and a blue dot below any reasonable bull bar. Naturally, this means it misses some of my important setups such as OR/1Rev at b3 and possibly some 1PB setups.

If you did nothing but trade these bars, most of your trades would be wins. Your losses would only be from b45-47 chop and possibly b74 L1. If you swung any contracts for any of your previous trades, you probably earned money overall.

Lets add some common sense to the mix and eliminate counter-trend trades and H1/L1 against strong moves. This gives only b45 as a losing trade of the day. Add a second common sense rule and do not take shallow H1/L1 with-trend unless its close to ema or trendline and you already have an all-winner day.

Monday, September 12, 2011

Major reversal: Bear Trendline break and HL


Usually a major reversal of a bear trend requires a strong break of the trendline and a LL test. But sometimes, there will no LL test and you would need to enter on a HL. These cases will run in a very hard trend for only one leg so you need to be able to identify these and enter on the HL.

The precondition to a strong reversal late in the day is a very strong move in the first hour (b1-b8). Without a prior show of strength, any reversal without a LL test is likely to fail.

The most important characteristic of a such a HL major reversal is that the trendline break will take out multiple swing points  (b57-63 took out 3 swing highs). The second important characteristic is that the trendline break move goes well beyond the ema and closes many points above in a one legged move. A multi-legged failed breakout giving a possible W (b19,50,57) of the range is more likely to fail than a one or 2 legged strong break of the TR.

After b63, traders should buy a pullback to the ema and possibly any reasonable pullback. A 2 legged pullback (b69 ended the first leg) is very desirable and will usually give a hard trend. This essentially works as an A2 or fL2 (b68 was L1), which can be traded as a swing entry after a reversal.

Friday, September 9, 2011

Wedge Failed breakouts


Often when the gap on open is large, there is an expectation of a trend move. While trend from the first bar is a reasonable expectation, some gap days will only result in a trading range. However, on some days you will see a wedge attempt in one direction that will take out the low of the day and often result in a measured move of the opening range.

The Wedge on open could form either with the gap or against the gap. When the wedge is with the gap as in today, it often appears as a variation of a 2-legged pullback to the ema.

To identify wedge on open, look for a large first bar (signifying TR), preferably with large tails (also TR) or overlaps (b3,4 -- also TR). After the initial move, the market will move in three pushes in either direction and give an entry fading the range. When the wedge move reverses the initial move and takes out the range extreme (b1 high), its a wedge failed breakout or WfBO. WfBOs are trend generators and should always be taken as a swing setup. At the very least they give two legs, often taking out the other end of the range. If the range is taken out in one leg, they often give a measured move of the range.

Thursday, September 8, 2011

Large bars could turn into spike and channel.


The bar b49 can be read in many ways. Its possibly an entry bar below b48, which was an A2 short second entry (with b45 as first). Its possibly a failed H2 with b44 as H1. In any case, its a trap bar that results in acceleration of the trend.

When a disproportionately large bar pops from nowhere as is the case with news related events, there is a very good chance it will turn into a spike and channel type of move. The exception is if it was a trend bar that triggered off a 2-legged pullback and has follow through.

Once the spike is determined, wait for a pullback and trade only in the direction of the channel. The channel (b58-69) will be in the same direction as the spike (b49) unless the pullback also had a large spike in the opposite direction.

Channels typically but not always consist of three pushes and will give a W termination (b70) and will test the begin of the channel (b75). They will then go to the mid-range of the channel (b81).

There is a good chance you missed out on the spike but the pullback and channel often go to a measured move of the spike.

Wednesday, September 7, 2011

Extremely strong trends


Soft trends and hard trends are two types of extremely strong trends. These should never be traded counter-trend. When you see a large up gap on the open and the first bar has a 1tf giving a fade entry near the low of the bar, there is already a very good chance it will turn into a soft-trend day.

When the second pullback is also a 1tf (b5), its a sign of a very strong trend. This essentially means bulls are buying the low of every short signal.

A well formed two legged pullback that does not quite reach the ema at b17 is another indication of strength. Often the first deep pullback is your best bet for a day long swing on a day such as this. However, any deep pullback such as b52 or b77 could be swung.

Folks who missed entering the first deep pullback can fade every L2. A soft-trend is the easiest to trade and you should take every deep 2 legged pullback even if you are conservative.

Avoiding counter-trend trading is very important. The first successful counter-trend trade was off b48. You should normally skip the first one and take the second one (b64 or b67). In general never attempt counter-trend trades until you see a one-legged move to ema such as b48-51

Friday, September 2, 2011

The most recent reversal determines direction of 1PB


Everytime there is an opening reversal (OR) after a trend move (b3-b5, b6-b7), you should expect a 1PB in the direction of the latest reversal. This is because 1PB is the first pullback in a trend and when the trend reverses, the expected direction also changes.

1PB is usually reversible. This means that if your 1PB entry immediately gives a signal counter to your entry, you entered incorrectly and should probably reverse your position. For example, if you missed the inside bar reversal at b8 and took a 1PB long at b10, you should reverse short at the 1PB short on b12. This way, your 1PB entry is usually self-correcting.