As many of you have guessed from the dots on the chart, I've been working on a Price Action Indicator for NinjaTrader. Currently, it only highlights reasonable signal bars as described in Al Brooks book and nothing else.
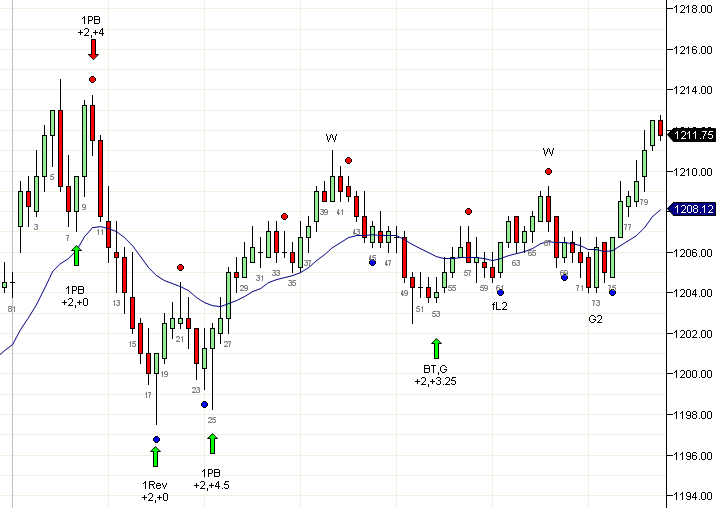
To mechanically trade the indicator, a scalp and a swing portion can be entered with a 6t stop. At +2 points the scalp portion exits with a profit and the stop moves to breakeven. Ideally, the scalp portion is twice the swing portion to get the best results. The swing portion should be exited at a fixed profit such as +4 or on a second attempt to reverse a trend if the entry is with trend, i.e, long at HL (b25) or short from LH (b10). If its a counter-trend entry, the first sell signal should cause any swing portion to be exited (entry above b18 or below b41)
On a day with reasonable range such as today this should profit from most trades. For example, today the only losing trade was the short below b57. The short below b34 and the longs above b45 and b69 were first attempts (L1/H1) and would not be traded. One option is to mark the L1/H1 in a different color since eliminating them is not an option since that would eliminate any signals in a hard trend.
A 2 contract scalp + 1 contract swing would have made +40 on the wins and -3 on the losses. But today was possibly an excellent day for the indicator and not all days are so generous. To collect more data, I would need to automatically trade it and run it over a couple of years worth of data. I expect poor performance on tight trading range days since two point scalps are probably hard on a 5 point day. Large range days would probably be indeterminate, causing stop outs before the profit target is reached but a single swing may compensate for many losses.
That's a pretty impressive indicator. If it gets too popular the successful trades will become counter to the signal. Seriously though, thank you for all you do in terms of education. Price action is tough to fully grasp even after you read volumes on it.
ReplyDeleteHello, CAD. Thank you very much for all the work that you put into this site.
ReplyDeleteCould you please clarify the characteristics of a well-formed bar? On Sept 13, you stated that they were 1. basically average size bars, 2. with strong close, 3. no overlap
Bars 10, 42, and 67 do not seem to fit criteria #2, as best as I can tell. Bar 10 had a 3 tick tail, so obviously there’s something I’m not understanding. Also, could you also please further clarify the criteria of no overlap. For example, does that mean the previous bar should not be an outside bar?
I very much enjoy your site and look forward to your posts daily.
Hi Cad, how do you determine overlap? With the prior bar or the bar before the prior bar or recent swing point or depending on bar type?
ReplyDeleteDo you care for gap openings - like b75?
Sellers came in at the open but the bar closed strong trapping the new sellers immediately. Which is a very strong signal IMHO. Same for b24, 42, 45, 57.
Do you care for trapped traders? I once programmed a indicator for TT with Metatrader.
b34 was a Doji, that could be filtered if CT (depending on the side and slope of EMA).
Is your criteria for b42 II?
I´m too working on a BPA indicator although with Metatrader trading GBPUSD.
Atm. I´m working on a spike indicator - but not for automated trading. Only for alerting purposes and trading subsequent PBs.
Thomas
http://farm7.static.flickr.com/6203/6156078244_929a46c32c_b.jpg
ReplyDeletemartinm, Those bars are inside bar variants and get a little leeway. Overlap is still a bit subjective, I have not quantified it and coded into the indicator yet.
ReplyDeleteTD, I do not particularly care about 1t gap between bars. If you look at a range chart, there will be gaps all over the place. I wouldn't read too much into it.
Cad, Thanks for your comments. You´re right about the opening gaps. They play a bigger role in determining the strength of a spike.
ReplyDeleteWhat about b8? It looks very reasonable to me. It has a low below the prior bar, a strong C, average size and engulfs the body of the prior bar.
Is b42 an II setup? With an II setup - do you care only for the bodies or the tails to be inside the prior bar too?
ReplyDeleteThanks for your response, CAD. I did some searching in Al's book for the term "overlapping" and found some explicit examples as to what he means:
ReplyDelete"Lots of overlapping bars in Fig 5.10"
Bars 1 through 2 in Fig 6.3
Bar 5 in Fig 8.17
The three bars after bar 7 in Fig 8.17
Bars 7 through 9 in Fig 8.21
It seems that buying high or selling low in anything resembling barb wire is not that good of a trade. -:)
TD, b8 is probably a decent bar and yes b42 is an ii. As I said, the indicator is constantly changing (almost every hour) since Im actively developing it. Some bars that wouldnt appear now may appear later, since its under contant modification
ReplyDeleteHi Cad, if you don´t mind me asking. Do you compare the current bar with the average ranges or just the bodies of candles and how many back?
ReplyDeleteTD, I'm trying several things out. I think the best option is to compare recent candles.
ReplyDeleteb21 has the same color as the preceding. bar. I saw on almost all other SBs, that they have the opp. color as the preceding bar. any reason for this?
ReplyDeletewhat is b24 as it has a particular large wick (same size as the body)?
b67 was an outside bar (opp. twin?)- you do not enter on outside bars very often?
do you check IIs (b42) for the right color/shape (e.g. no doji) to enter?
do you care for double tops/bottoms on consecutive bars?
Hi Cad,
ReplyDeleteIs your indicator script available for download or purchase?
Ron,
ReplyDeleteThe indicator is still under heavy development. If I make it available now, I would need to send daily updates. I may broadcast it live for a reasonable fee until its stable.
Cad,
ReplyDeletebear move from b10 to b17 was a very tight bear channel. what makes b18 a tradable long when there was no prior bull strength or TL break?
Thanks.
z.cui,
ReplyDeleteb8,9 was prior strength and the move down can be read as the second leg down.
However, the answer to your question is that the move to b17 was a trend attempt and b18 was a possible 1st reversal since it was early in the day.