Showing posts with label fBO. Show all posts

Friday, February 3, 2012

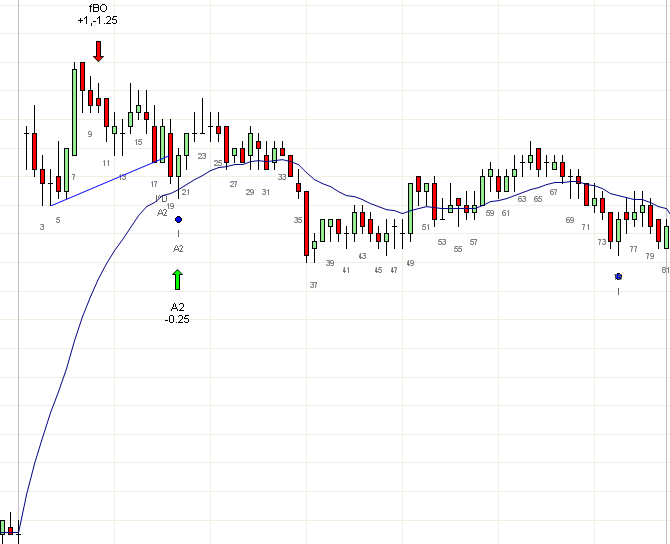
Trading range as a series of fBO


If trends can be seen as a series of breakout pullback, then trading ranges are a series of failed breakouts. I normally avoid trading fBO unless the range is wide enough to net an acceptable profit. In general that means if you like a profit of about 2 points, you want the range to be twice as much, i.e. 4 points.

The reason is that many fBO trades will fail to go to the other end of the range (b33,b40). Thus narrow trading ranges cannot be profitably traded using stop entries with consistency. Even weak wedges such as b40 are usually not worth trading.

The quality of signal bars is very important in entering any trade as it is directly correlated to success rate. The quality of the bars around the signal bars is equally important. On a chart with mostly well formed bars, you can take any decent signal bar but on a barb wire chart you cannot expect a move large enough to justify a trade.

But eventually, the market will move out of the tight range and create bars that become tradable (b75-81). If this occurs with sufficient time before the close unlike today, you can look for high probability trades.

Monday, January 30, 2012

Opening range: 1Rev vs 1PB vs fBO


It is important to know the definitions of 1PB, 1Rev and fBO to correctly trade the opening range:


  • 1PB is the first pullback after a strong or successful trend attempt
  • 1Rev is a strong reversal after a weak or moderate trend attempt 
  • fBO is a failure to create a trend breakout of the opening range

If we look at b1 today, its clearly a trading range bar. There is no trend yet. Some traders will buy the low of b1 hoping for an fBO. However, this is dangerous since b2 can be a large trend bar that continues the downward move.

b2 attempted to break into a bear trend and failed. At this point, we have a fBO. However, its not tradable since the signal bar is weak and we would be forced to buy mid-range. Note that this is not a 1Rev, since only trends can reverse and there are no reversals within a trading range.

b3 is a trend bar, but since it did not breach the trading range, its not a successful BO. b3 is not a 1PB since there is no trend and its a bar of the wrong color in any case. If b3 was very high and a bear bar, you would be selling near the high of the trading range and you could argue its a 1PB even though b2 was a weak breakout bar.

b4,5 again is an fBO but the signal bar is a weak overlapped doji and is not worth trading. If a trading range is at least 4 points and the other end is at least 2 points away, often the signal will work for about half of it (1 point in this case), but often its just a distraction because a clearer setup is usually just a couple of bars away.

b6,7 is an inside bar and a LH after a LH and LL, so a possible trend. However, it would be a very shallow 1 legged pullback after a weak reversal bar b5. You don't really want to sell near the low of a trading range unless its at least a 2L pb.

b9,10 is a W reversal and since we have a weak down trend, this can be labeled a 1Rev. Since the reversal was not near HLC of prior day, its not an OR; therefore it is labeled XOD (extreme of the day).

Tuesday, January 10, 2012

Inside bar after BO bar


An inside bar right after a BO bar (b8, b37) often signals a failed breakout. A failed breakout does not automatically imply a trend move will setup, but since failures generally have at least two legs, a strong signal near a support such as b20 reversal bar at ema is an acceptable signal.

However, when the range is small, the market will often give a fBO or BP at the other end of the range as we saw at b37. This time it resulted in a complex pullback all the way to b67. One approach to maximizing fBO trades is to exit part on a strong push such as b17,b19 or b49 and exit the balance on any strong counter-trend signal such as b20 or b65.