When bars are huge, I look to other options than the 5m chart. I have discussed volume charts and tick charts previously. In the first hour I also look at 3m charts for clarity.

An entry above b13 with a stop below is a canonical entry and has about 7 point risk. Since you can move the stop below the entry bar after the entry bar closes, an entry above 3m b14 is a valid entry with a stop below. This reduces your risk to 4.5 points.
On a day such as this, when you are looking at a potential 20 to 40 point move thats a reasonable risk.
Another option is to buy the close of b14 with a stop below its close. This reduces the risk to about 2 points. This is very reasonable given the potential upside. However, its hard to do given that its a potential 1tf. Conservative traders will probably want to buy above a bull bar with a strong close. Remember, all the above are effectively buying above b13, you are just managing your risk based on subsequent bars.

Yet another option is to buy on the 1-minute chart. It should be noted that trading reversals on the 1-minute chart should absolutely never be done since it is possibly the fastest way to blow your account. However, two failures to continue the trend after a potential reversal (above 1m b45 after 1m b38 reversal) is a valid entry. Note that is should only be taken after the 3m and 5m charts have already shown reversals. A 1m chart on its own can never be trusted for a reversal signal.
The 1m entry above b45 corresponds to buying at 1141, one point below the top of 3m b15 or 5m b9. As you can see, the 1m did not give the most optimal entry, the 3m did.
What the 1m does is allow you to pretend its a very fast moving 5m chart on a day with huge bars. Note that even on the 1m, bars were 2 to 4 points. It gives more entries and smaller risks. Fading 1m reversals in a very strong trend is also a very good play but only when the trend is super-strong such as this day.
The best option for most new traders is to only read the 3m chart for the first hour and then switch to the 5m chart and not even look at 1m chart until a potential signal sets up on the higher timeframe chart. Once bars start getting smaller or overlapped (b23-b27), you should no longer look at 3m or 1m chart or you are likely to lose due to many poor setups on a lower timeframe chart.
Don't forget that the 5m chart is your staple and you have much less experience with other timeframes. Your reads should consistently be off the 5m chart and use lower timeframes only for entries during extremely large bars and only in the early part of the day.
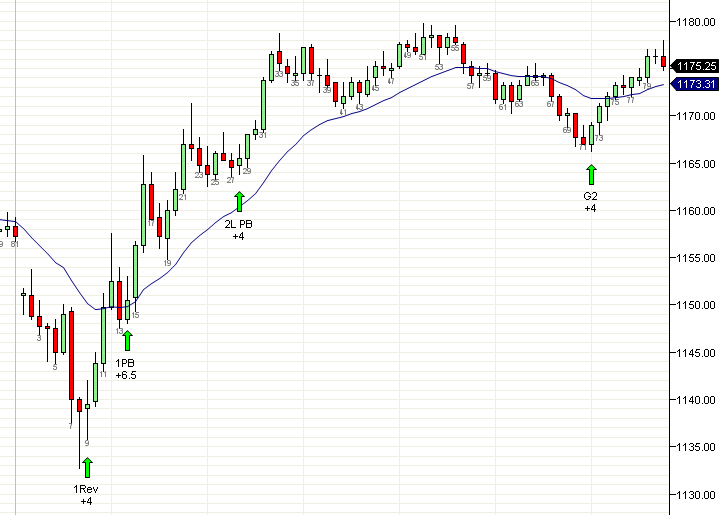
How do you know when to buy or sell a shallow pullback, such at b28? Thanks for your help!
ReplyDelete