Tuesday, December 10, 2013

Random walks and predictable trends


The random walk hypothesis suggests that market moves are purely random and what appears to be trends are simply accumulation of sporadic random moves that happen to occur in the same direction for a duration of time.

The idea is that buyers and sellers mostly cancel each other out, and the net difference causes a perturbance in the  price of the underlying.

The random walk hypothesis is pretty absurd since it assumes that the probabilities of buys and sells stay same with price movement. It should be obvious to even the lay person that a stock at $1 can have twice the buying pressure as a stock at $2.

Traders know very well about herd mentality, the rush to join a successful move and abandonment of a spent move. Fear and greed are the true drivers of the market, not randomness. This is true at least for trending markets.

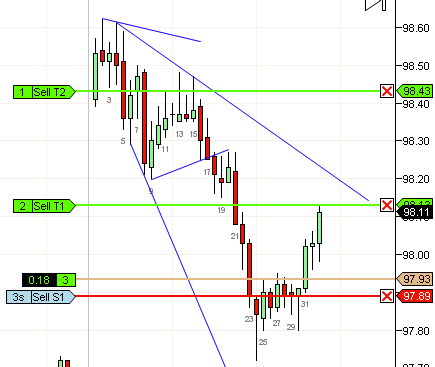
However, when the market is not trending, random movements are perfectly possible. To figure out what movements are random, I ran a simulation where every move went up or down based on probability. When the probability is 50%, the market essentially becomes BW (as in b2-b5). When the probability is slightly imbalanced, we get a sloping channel (b49-59).  In general, if the bodies are sloping, its a slightly imbalanced channel. In either case, they are traded the same way. You wait for a trend to break (b9 was LL-LH-LL) and then take the first pullback (b15 or a better bar at b17) or wait for the breakout to reverse and take the reversal (b24 or the next HL, b30)

Taking the correct bar with the right stop is tricky and deserves its won post but as you can see on this day, its possible with some practice. Moves from randomness often lead to sharp trend attempts that often reverse or otherwise get arrested, so its important to take profits conservatively.


Monday, December 2, 2013

Smaller stops, larger gains


After an in-depth survey of my trading results, I discovered that my best trades have the least maximum adverse excursion (MAE) or pullback. Many were under 5t. Therefore, I embarked on an investigation to figure out if it was actually possible to trade on a 5t stop if I chose my trades very carefully. The trick was to find a way to objectively measure the effectiveness of such a small stop and whether a larger stop (10t) would succeed on the exact trade if a 5t stop would fail. One way to do this was to have two stops, one at 5t and the other at 10t. And then measure fraction of trades that were successful on 5t stops.

The plan was to have two stops on entry at 5t for two contracts and 10t control for an additional contract. Once the price moves past the entry bar, all stops could be tightened to 5t.

The three possible results are:

  • both stops taken out: Trade was a total failure
  • 5t stop taken out, trade eventually fills at least 20t: Trade was a partial success
  • neither stops are taken out: Trade was total success


Preliminary results suggest that most trades that are stopped out with a 5t stop would also be stopped out with a 10t stop.

At this point results are preliminary and I do not believe I have sufficient data to draw a broad conclusion in all market conditions.

However, I do believe that for people whose success rate is under 60% or so, the benefits of smaller losses from tighter stops outweighs the small number of gains lost from partial failures. A 20t gain vs a 5t stop is a 4x profit factor and can greatly steepen your profit curve.


Thursday, November 28, 2013

Choppy waters


Success in trading (or investing or gambling or any kind of speculation for that matter) is primarily the mastery of balancing risk versus reward against probability of win. A buyer of a lottery ticket makes a rational choice of wagering a nearly zero-impact amount on a potential windfall of low probability. A casino gambler is essentially in it for the thrill and may choose to do something similar (bet on number 6 on roulette or bet on red) to maximize gains on a low probability but much more realistic than the lottery buyer.

A trader should aim to only trade when a win far outperforms the losing trade by probability. This means that if on an average if you have a 50% win rate, your wins have to be at least larger than your losses by just a bit. The larger your wins compared to your losses, the steeper your account growth. You should typically only trade when your wins are expected to be twice as large as your losses. This will enable you to be a break-even trader with 33% win rate.

Your win rate depends on your skill of course, but more importantly, it depends on how the price action is unfolding. In a very strong trend, taking with-trend trades is a good win/loss ratio regardless of the probability of success. This is why sometimes in a strong trend, its ok to re-enter right after you were stopped out (as long as the trade was in the direction of the trend).

The worst time to trade is when your win/loss ratio is poor even with high probability of success. Today's price action reflects such a day. When the bars are small and doji-ish and the swings are small, its unlikely you will make huge profits on runaway trends. Even your scalps may fail despite the patterns you expected playing out as predicted.

Therefore the first lesson in profitability is to be able to simply recognize chop and sit out.


Friday, November 1, 2013

Quick breakeven exit strategy for experimental trades


When you start out trading your primary concern should simply be avoiding total destruction of your account. This is a hard goal to achieve, but one of the ways many traders approach this is to quickly move to breakeven when possible. This means that you give up potential profits in exchange for lower risk. All experimental trades (where you are trading to collect data rather than make money) are also traded in the same manner.

There are many breakeven strategies and this the one I'm currently trying:

  • Trade 3 contracts with -10t stop
  • Exit the first one at +10t
  • On fill, tighten stop to -5t
  • Exit second contract at 20t and tighten stop to entry price 
  • Exit last contract at 40t (or swing last contract)
Your varying degrees of success are:
  1. Trade fails: -30t
  2. First target filled but pullback is 5t or more: 0t
  3. Second target is filled followed by 0t stop taken out: 30t
  4. Third target is filled: 70t
Lets assume that the chances of the outcomes are as follows
  1. Half your trades will breakeven: -0t: 50% 
  2. Of the remaining, half will be total losers: -30t: 25%
  3. Of the remaining, half will work for profit: 30t: 12.5%
  4. Remainder: 70t: 12.5%
Your net average chances of a win are about 5t per trade, barely enough to cover commissions. However, you never really had hopes of winning trading a different exit strategy anyway, so this approach may work better simply by reducing the risk of losing from 50% to 25%. Note that you are now able to trade breakeven with only 25% win rate, which is a significant lifeline for a novice trader.


Wednesday, October 16, 2013

Targets on multiple contracts


I've been experimenting with various exit strategies and my current strategy is the following:

When trading one contract, exit at 2x risk (for CL 10t stop, 20t target)

When trading two contracts, exit one at 2x risk, one at 5x risk (10t stop, 20t, 50t targets)

When trading three contracts, exit two contracts at 2x risk, one at 5x risk (10t stop, 2x 20t, 50t targets)

When trading any other even number of contracts, divide in half and trade like its two contracts.

When trading any other odd number of contracts, exit half + one contract at 2x risk, half - one contract at 5x risk. (i.e. for 5c, exit 3c at 20t, 2t at 50t)

The 5x risk above is a swing target and must be adjusted according to market action. For example, you may need to make the target modest if the day looks like it will be small or let it run if the market looks like it could run all day.

Note that Ninjatrader summary of trades uses the first exit to denote exit time and your swing exit can only be seen if you uncheck "Group Trades by ATM strategy". Therefore to see your swing exit, you need to parse through a longer table as shown below:


Friday, October 11, 2013

Trendlines and TCLs as targets


Just as a TL indicates favorable locations for entry, TCL typically indicates favorable location for exit. This is because price typically moves in channels and traders enter near one end of the channel and exit on the other.

When the channel is steep and narrow, the market is typically trending and trading is feasible only in one direction.

When the channel is wide and not very steep, it becomes feasible to trade in both directions.

Today's trades show two setups where exits are made at TL and TCL.

Trade #2 was a short which reacted at the TL and forced an early exit.

Trade #3 was a long which poked the TCL and was a favorable exit. A TCL violation and a large bar are both signs to exit since a potential extended pullback is likely to follow. The sidebar image shows an exit order placed at the TCL.

Any shorts at b22 should look to exit near the test of the TL (near b27).

When a TL cannot hold the price, you may see a breakout well beyond the TL or may react very weakly. Such an event is a trend break and you should no longer trade in the direction of the trend. Continuation trades are typically such breakouts beyond the nacent counter trend in a pullback (b7,10).

Friday, October 4, 2013

Shallow and deep pullbacks with trendlines


I have often advised new traders to only trade deep pullbacks or obvious pokes into the trendline. This is usually very good advice on most days. The only exceptions are possibly hard trend days, where you can really take any small bar near or touching the trendline and soft-trend days, when you can take any fL2.

Trade #1 illustrates a shallow pullback. The price barely pokes beyond the trendline. The signal bar b6 is also a poor bar and in the middle of a BW. However, 2L 1PB when successful can go quite a while, so I often take it despite it being a lower probability trade.

Trade #2 on the other hand illustrates a deeper pullback. b10 clearly has poked well beyond the TL and therefore is more likely to give an entry bar (b12) that does not take out a stop.

Trade #3 is an fBO trade. Note the smaller size since its always better to sell the next pullback after the fBO succeeds

Trade #4 is a reasonably deep pullback since b27 poked many ticks beyond the TL and also gave an entry bar b28 that did not take out any stops.

Trendlines enable entries and also point out obvious exits. For example, the W down to b13 violated the TCL b2,8 and the the sell from b27 stopped at the trendline from LOD of prior day.

With discipline, simply entering on every deep poke of the trendline should be a viable trading strategy.