Tuesday, December 10, 2013
Random walks and predictable trends
The random walk hypothesis suggests that market moves are purely random and what appears to be trends are simply accumulation of sporadic random moves that happen to occur in the same direction for a duration of time.
The idea is that buyers and sellers mostly cancel each other out, and the net difference causes a perturbance in the price of the underlying.
The random walk hypothesis is pretty absurd since it assumes that the probabilities of buys and sells stay same with price movement. It should be obvious to even the lay person that a stock at $1 can have twice the buying pressure as a stock at $2.
Traders know very well about herd mentality, the rush to join a successful move and abandonment of a spent move. Fear and greed are the true drivers of the market, not randomness. This is true at least for trending markets.
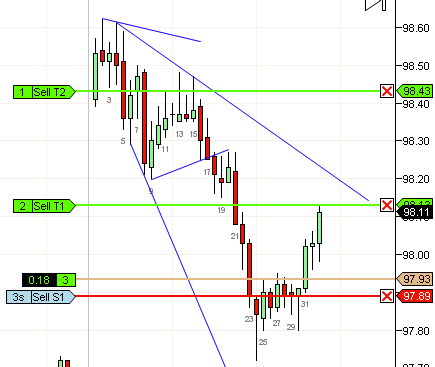
However, when the market is not trending, random movements are perfectly possible. To figure out what movements are random, I ran a simulation where every move went up or down based on probability. When the probability is 50%, the market essentially becomes BW (as in b2-b5). When the probability is slightly imbalanced, we get a sloping channel (b49-59). In general, if the bodies are sloping, its a slightly imbalanced channel. In either case, they are traded the same way. You wait for a trend to break (b9 was LL-LH-LL) and then take the first pullback (b15 or a better bar at b17) or wait for the breakout to reverse and take the reversal (b24 or the next HL, b30)
Taking the correct bar with the right stop is tricky and deserves its won post but as you can see on this day, its possible with some practice. Moves from randomness often lead to sharp trend attempts that often reverse or otherwise get arrested, so its important to take profits conservatively.
Monday, December 2, 2013
Smaller stops, larger gains
 After an in-depth survey of my trading results, I discovered that my best trades have the least maximum adverse excursion (MAE) or pullback. Many were under 5t. Therefore, I embarked on an investigation to figure out if it was actually possible to trade on a 5t stop if I chose my trades very carefully. The trick was to find a way to objectively measure the effectiveness of such a small stop and whether a larger stop (10t) would succeed on the exact trade if a 5t stop would fail. One way to do this was to have two stops, one at 5t and the other at 10t. And then measure fraction of trades that were successful on 5t stops.
The three possible results are:
- both stops taken out: Trade was a total failure
- 5t stop taken out, trade eventually fills at least 20t: Trade was a partial success
- neither stops are taken out: Trade was total success
Preliminary results suggest that most trades that are stopped out with a 5t stop would also be stopped out with a 10t stop.
At this point results are preliminary and I do not believe I have sufficient data to draw a broad conclusion in all market conditions.
However, I do believe that for people whose success rate is under 60% or so, the benefits of smaller losses from tighter stops outweighs the small number of gains lost from partial failures. A 20t gain vs a 5t stop is a 4x profit factor and can greatly steepen your profit curve.
Subscribe to:
Comments (Atom)


